Extraction of structural and functional information from brain images
Chair: Prof. Ulla Ruotsalainen, Tampere University of Technology, Finland
The focus of the workshop will be on imaging at different levels and the integration of imaging information, particularly data integration from multimodal imaging sources, multi-level data integration between microscopic and macroscopic and integration and extraction of data from large data-bases
Invited speakers:
Research Center Jülich, Germany
Title: Towards a multimodal architectonic atlas of the human brain

- The relatively low spatial resolution of functional imaging techniques in the range of several millimeters or more;
- The high intersubject variability in the sulcal pattern of the human brain, and in the size, location, and microstructure of the cortical areas, including variability in the location of areal borders with respect to macroscopical landmarks;
- The problems inherent in traditional cortical maps (e.g., the Brodmann map) including the subjective nature of the definition of areal borders, the lack of data with respect to intersubject and interhemispheric differences, and missing information on the three-dimensional extent and localization of the areas.
Therefore, we are developing three-dimensional, probabilistic cytoarchitectonic maps of cytoarchitectonic areas, which are based on an observer-independent mapping in histological sections of ten human post-mortem brains. Data from cytoarchitectonic analysis of cortical areas, examples of the comparison of probabilistic maps with activations obtained in functional MRI for structure-functional analyses, and data from quantitative receptorautoradiography of classical neurotransmitter systems will be presented. These examples illustrate how multimodal mapping of the human brain may contribute to accomplish our understanding of the relationship of brain structure and function.
McGill University, Montreal, Canada
Title: Cortical anatomical networks identified by structural MRI 
Abstract: Most imaging studies of brain connectivity have focused upon functional connectivity (Micheloyannis et al. 2006; Stam et al. 2007, Salvador et al. 2005; Achard et al. 2006) These studies demonstrated that functional networks have “small-world” properties, where the minimum path length between any pair of nodes approximates that of a comparable random network but the nodes have greater local interconnectivity (Watts and Strogatz 1998). However, little is known about anatomical connectivity. Connection models of the human brain are usually inferred from primate research (Stephan et al. 2000; Penny et al. 2004). We have developed a methodology for characterizing the regional correlation of MRI-derived cortical thickness, using (i) the CLASP algorithm for the fully-automated extraction of cortical surfaces (MacDonald et al., 2000 ; Kim et al., 2005, Lyttelton et al., 2007), and (ii) a graph theoretical approach to the study of cortical morphology. This technique, GRETNA (Figure 1), examines the correlation among morphological properties of different cortical regions. It employs network theory to assess the clustering (Cp) and mean path length (Lp) among cortical regions.
GRETNA was applied to brain MRI data from 124 right-handed normal adults. The resultant brain network contained 45 nodes and 102 edges2 (~7% of all possible pairs). It demonstrated significant short- and long-range correlations of cortical thickness, corresponding to known fibre connections. The pattern of coordinated variation in the thickness was neither regular nor random but “small-world” in nature, characterized by a high Cp and short Lp. GRETNA revealed a modular architecture in the normal structural brain network which reflects known functional neuroanatomy (Chen et al., 2008). Six modules with denser intra-module than inter-module connections (Newman and Girvan, 2004). This segregation into six modules with apparent functional significance suggests that functional organization of human brain networks may have a modular anatomical correlate.
Finally, we used GRETNA to investigate the small-world efficiency of cortical networks in 425 relapsing–remitting MS patients (Charil et al., 2007). Using total WM lesion load (TWMLL) as a measure of disease severity, we defined six groups with increasing mean TWMLL. Both local (~Cp) and global (~1/Lp) efficiency showed significantly negative correlation with TWMLL (Fig. 2). Our results suggest that distributed cortical networks exhibit reduced efficiency in MS, consistent with aberrant fibre connection caused by MS lesions in white matter.
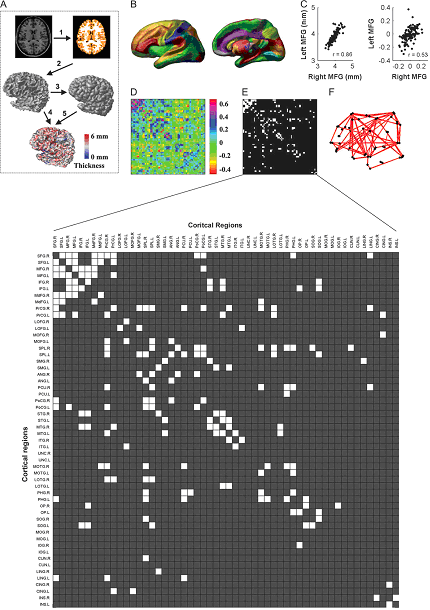
Figure 1: Human brain anatomical networks using cortical thickness measurements from MRI. (A) Cortical thickness CLASP. Images are classified (1) to extract gray matter surfaces (2,3). Cortical thickness is measured at each vertex (4,5). (B) Cortex is segmented into 54 areas. (C) Anatomical connection is defined as statistical association in thickness of two areas across subjects,e.g. R.middle prefrontal gyrus has significant association with its L. counterpart. Left plot showed the associations using raw cortical thickness values, the right plot showed residuals after removal of mean thickness.
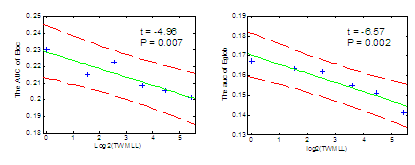
Figure 2: Multiple Sclerosis brain network efficiency changes with the TWMLL. The Area Under the Curve (AUC) provides a stable measure of local efficiency (left) or global efficiency (right) across all wiring costs surveyed. Both are progressively degraded with increasing MS total white matter lesion load (TWMLL).
University College London, UK
Title: Imaging functional organization and plasticity of neuronal populations in intact visual cortex with single-cell resolution
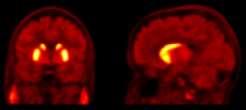
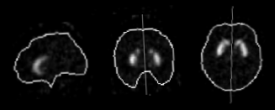
Abstract: The vast majority of our knowledge about how the brain encodes information has been obtained from recordings of one or few neurons at a time or from global mapping methods such as fMRI. These approaches have left unexplored how neuronal activity is distributed in space and time within a cortical column and how hundreds of neurons interact to process sensory information. Recent methodological advances now enable the simultaneous recording of neuronal activity from hundreds of neurons in the neocortex by means of in vivo two-photon calcium imaging (see Figure). Specifically, we use this approach in the mouse visual cortex to characterize the detailed functional organization of a cortical columns and investigate how individual neurons and neuronal subsets interact within a large cortical network in response to visual stimuli. We investigate the role of experience on the plasticity of cortical network function after the onset of vision.
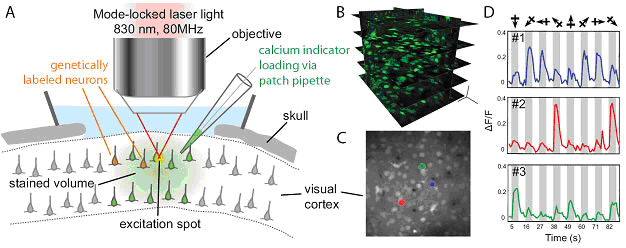
In vivo two-photon calcium imaging. A. Schematic of multi-cell bolus loading: a membrane-permeable acetoxymethyl (AM) ester of a calcium-sensitive fluorescent dye (e.g. Oregon Green 488 BAPTA 1) is ejected from a micropipette into the extracellular space of the cortex, from where it diffuses into cells. Intracellular esterases hydrolyze the ester bond, rendering the indicator dye membrane-impermeable. Activity-dependent changes in intracellular calcium concentration can be monitored using two-photon fluorescence microscopy in a depth of up to 500 μm. Additional labeling with genetically encoded fluorescent proteins enables identification of specific cell-types (e.g. interneurons). B. Reconstruction of a 3D volume in mouse V1 stained with OGB1- AM. Scale bars, 50 μm. C. Fluorescence image of V1 neurons. The colored regions of interest refer to the calcium time courses in D. D. Response of three neurons to the direction of a drifting grating stimuli. Traces of ΔF/F versus time reflect changes in calcium concentration.
